We pride ourselves on having a varied and full curriculum, with students achieving success across a range of subject areas, enabling them to progress to a diverse range of HE courses, apprenticeships and careers that align to their individual ambitions and aspirations. Our examination results are excellent and reflect the work of committed staff and students. This success has placed the school on the Sunday Times Parent Power list for many years and.
Exam Results
Latest Exam Results
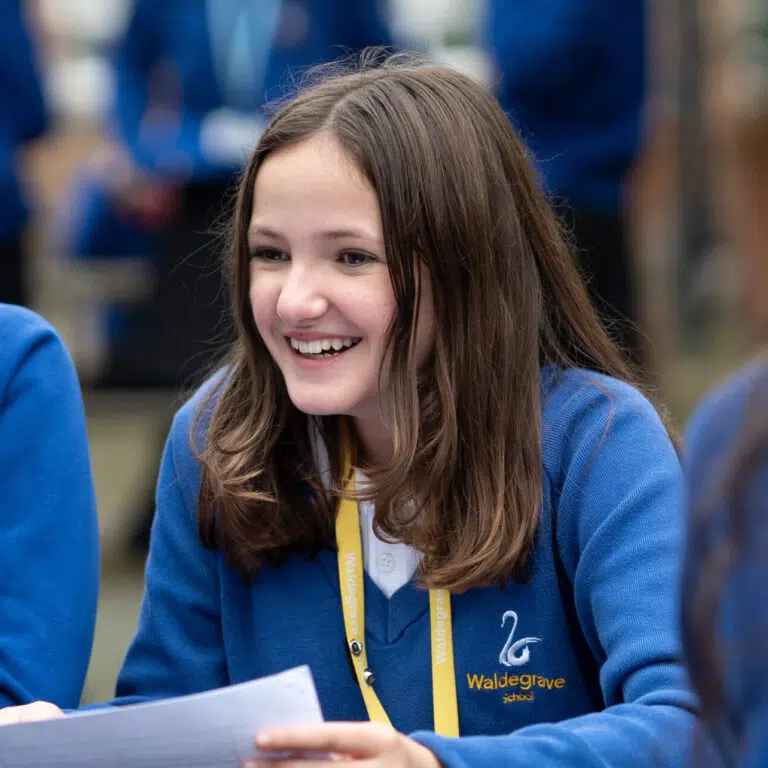
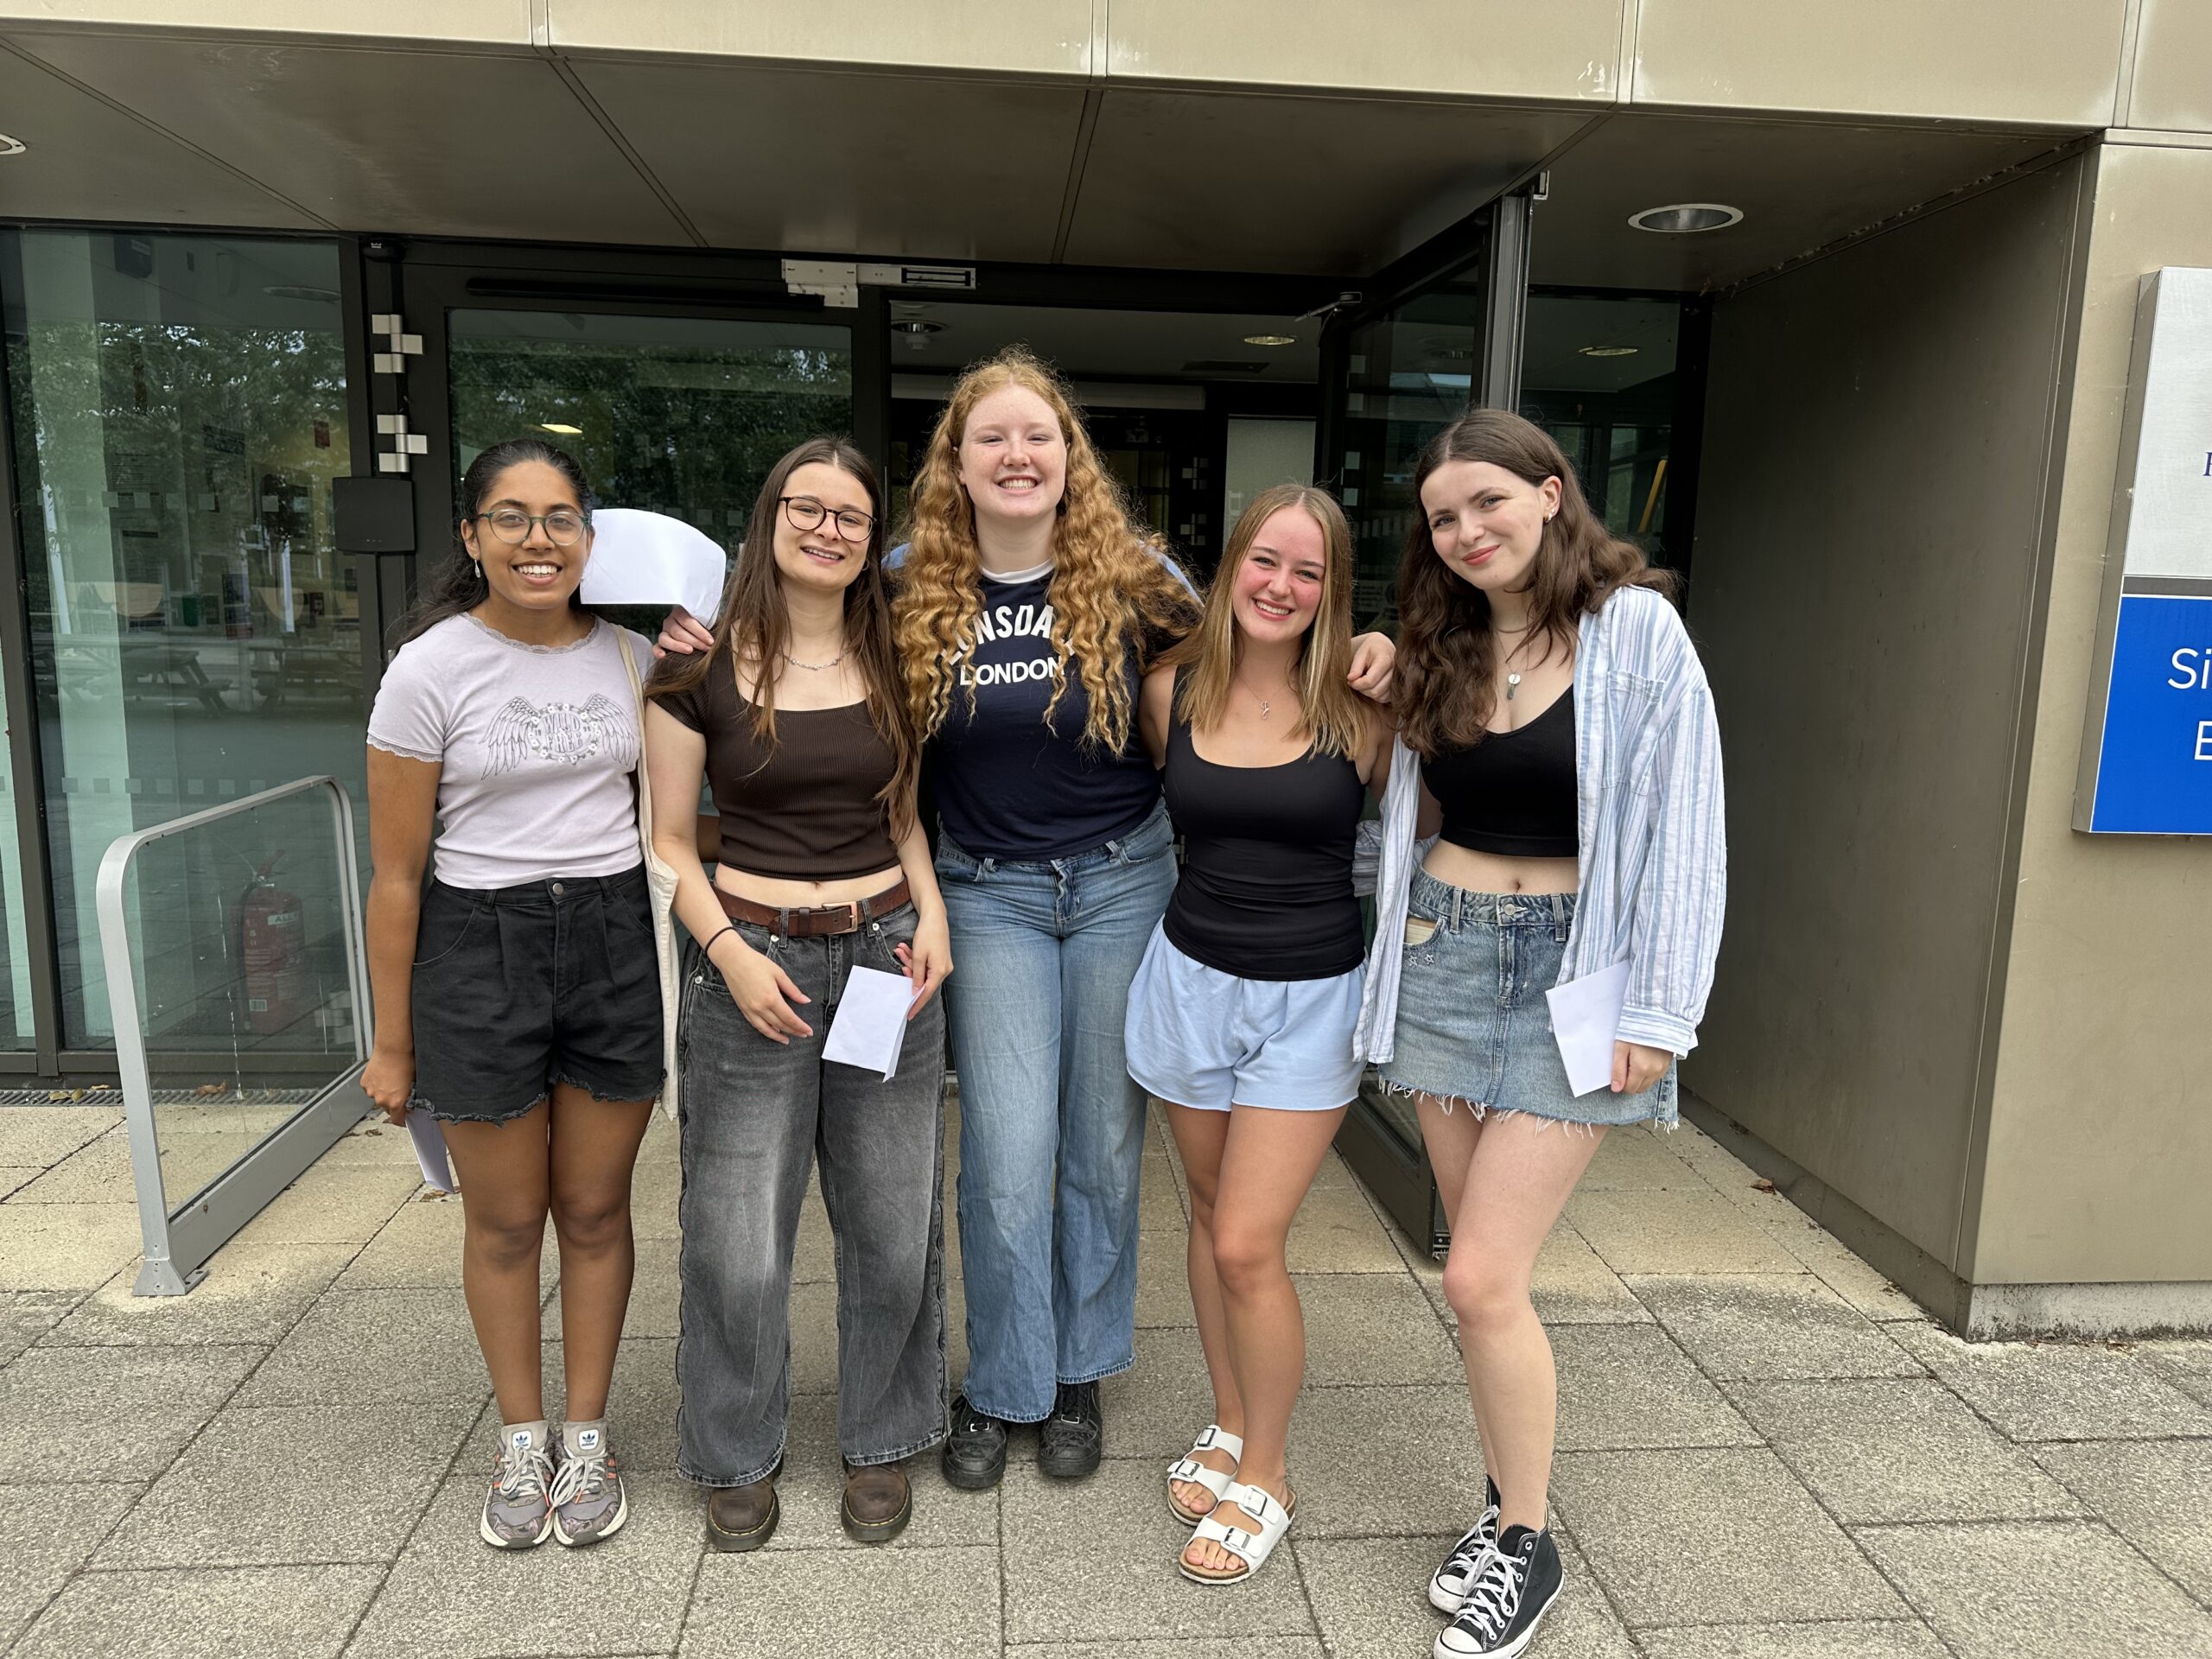
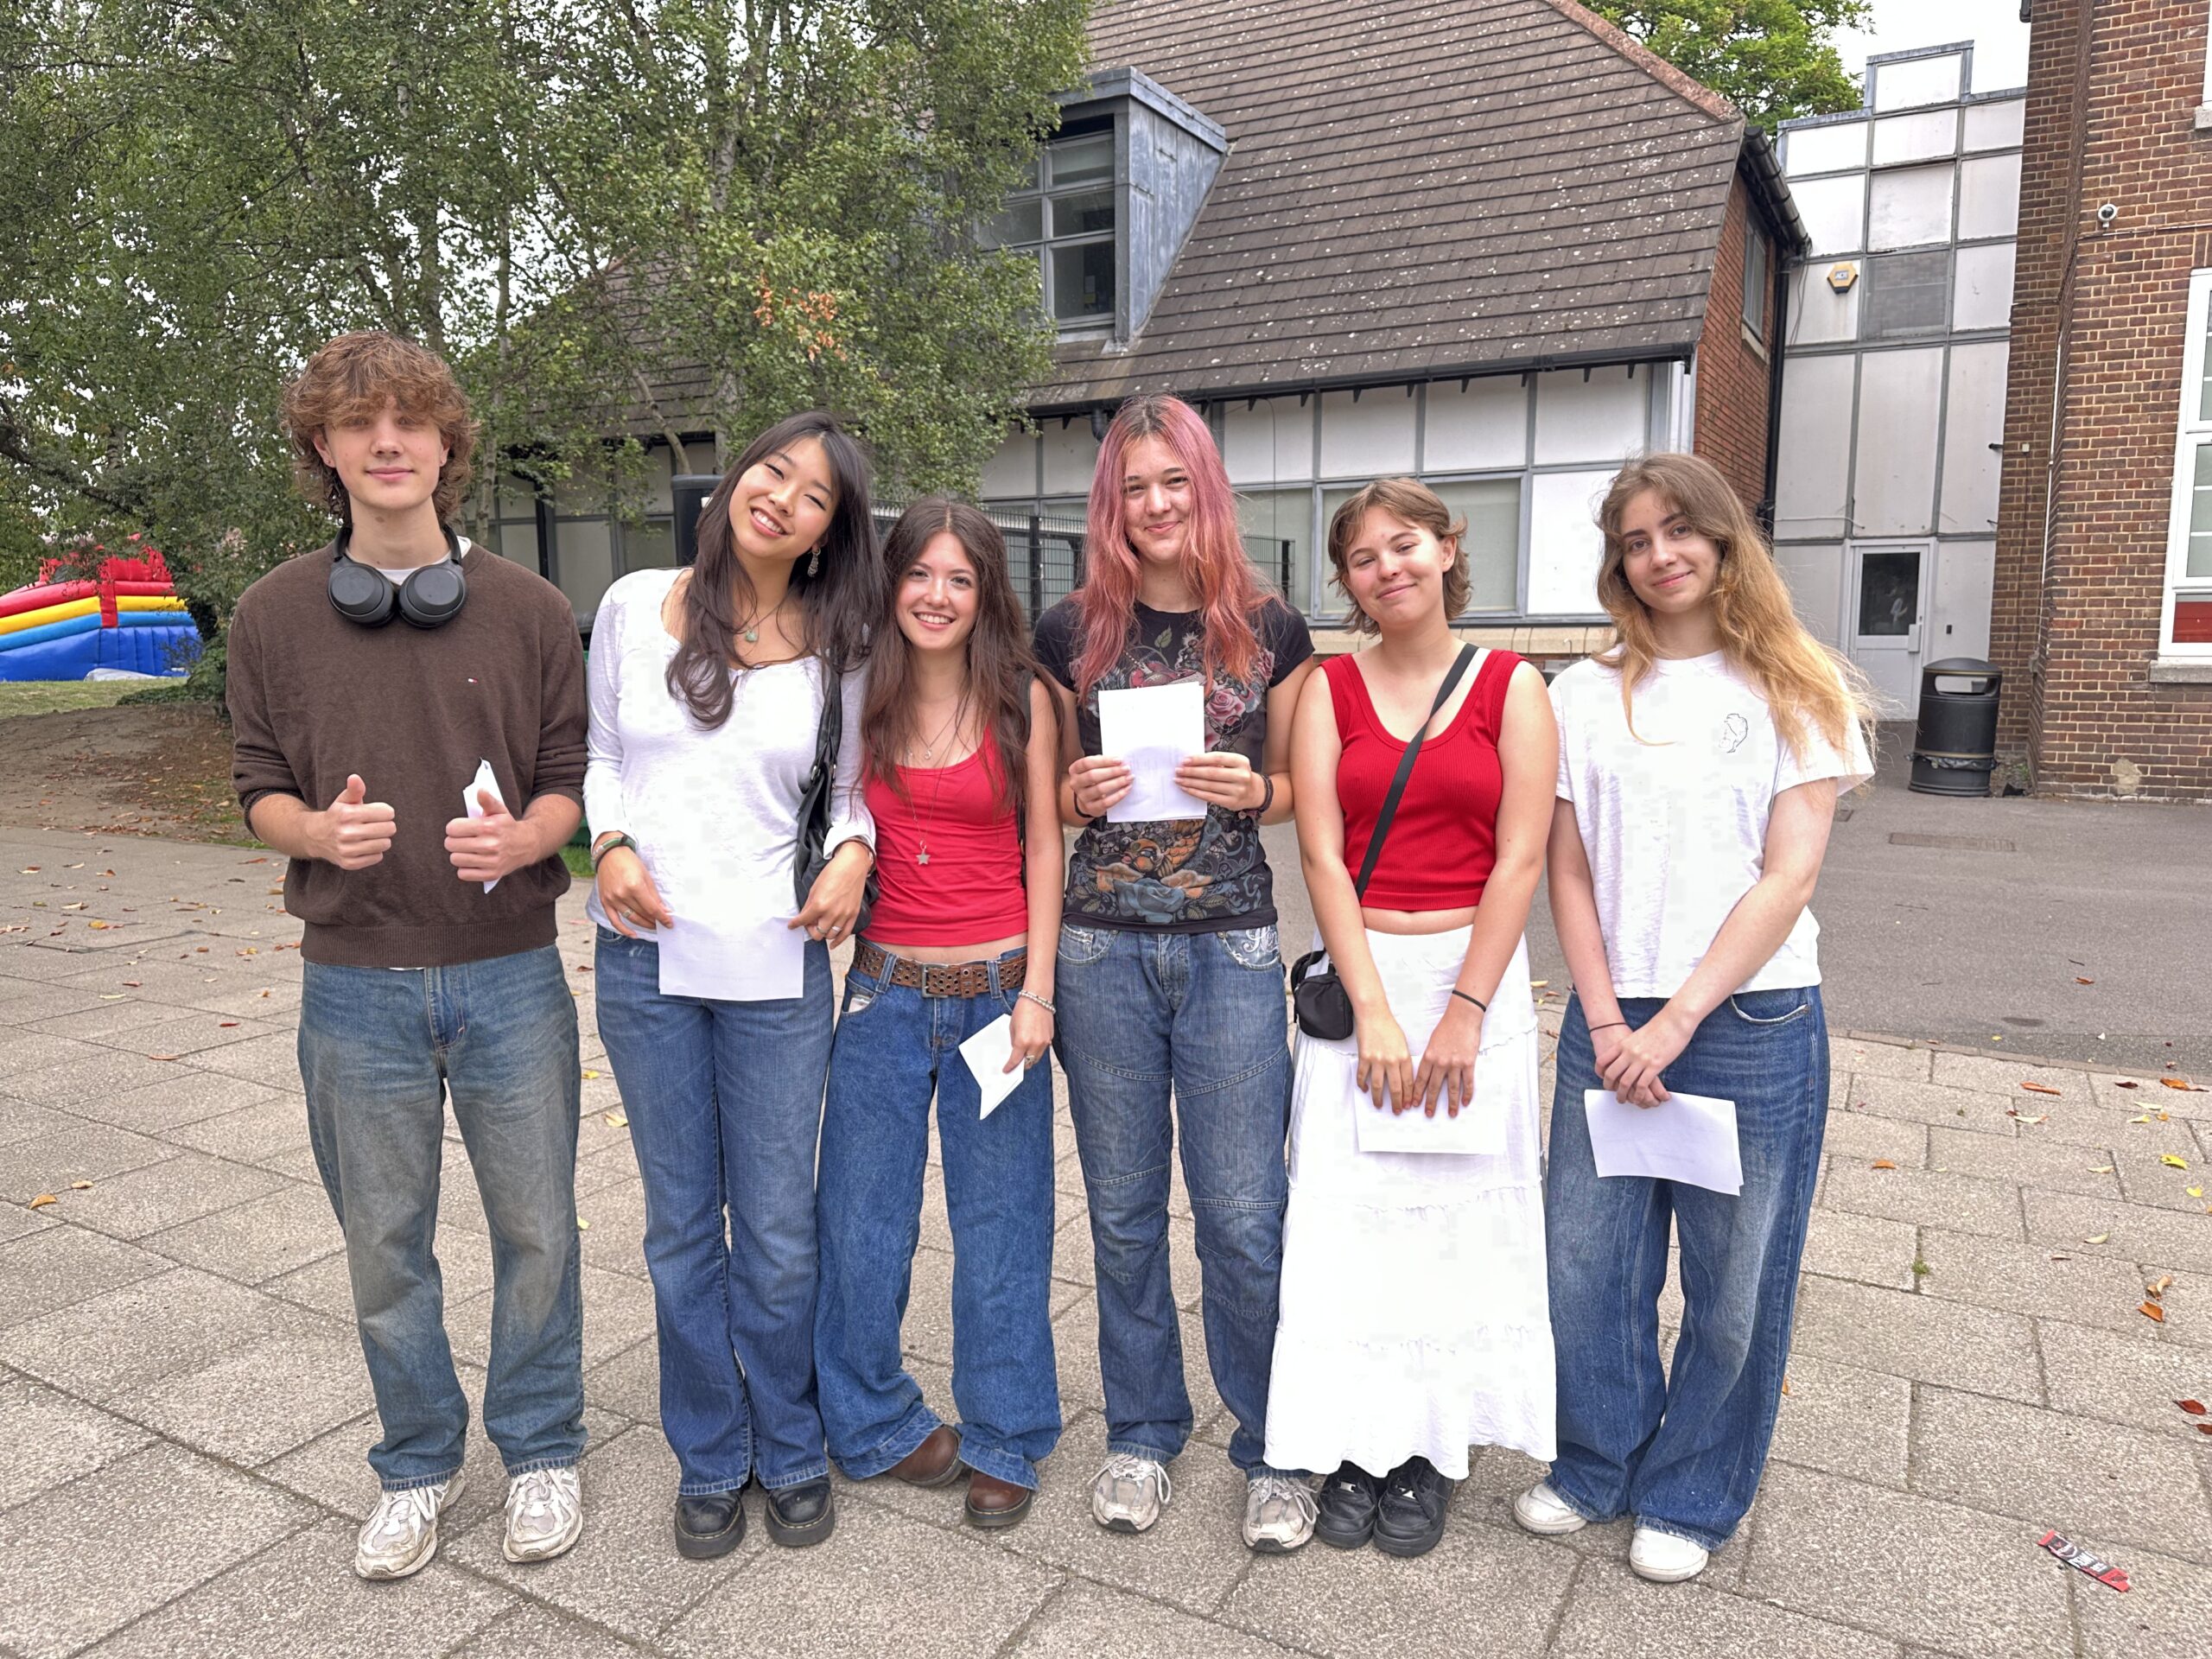
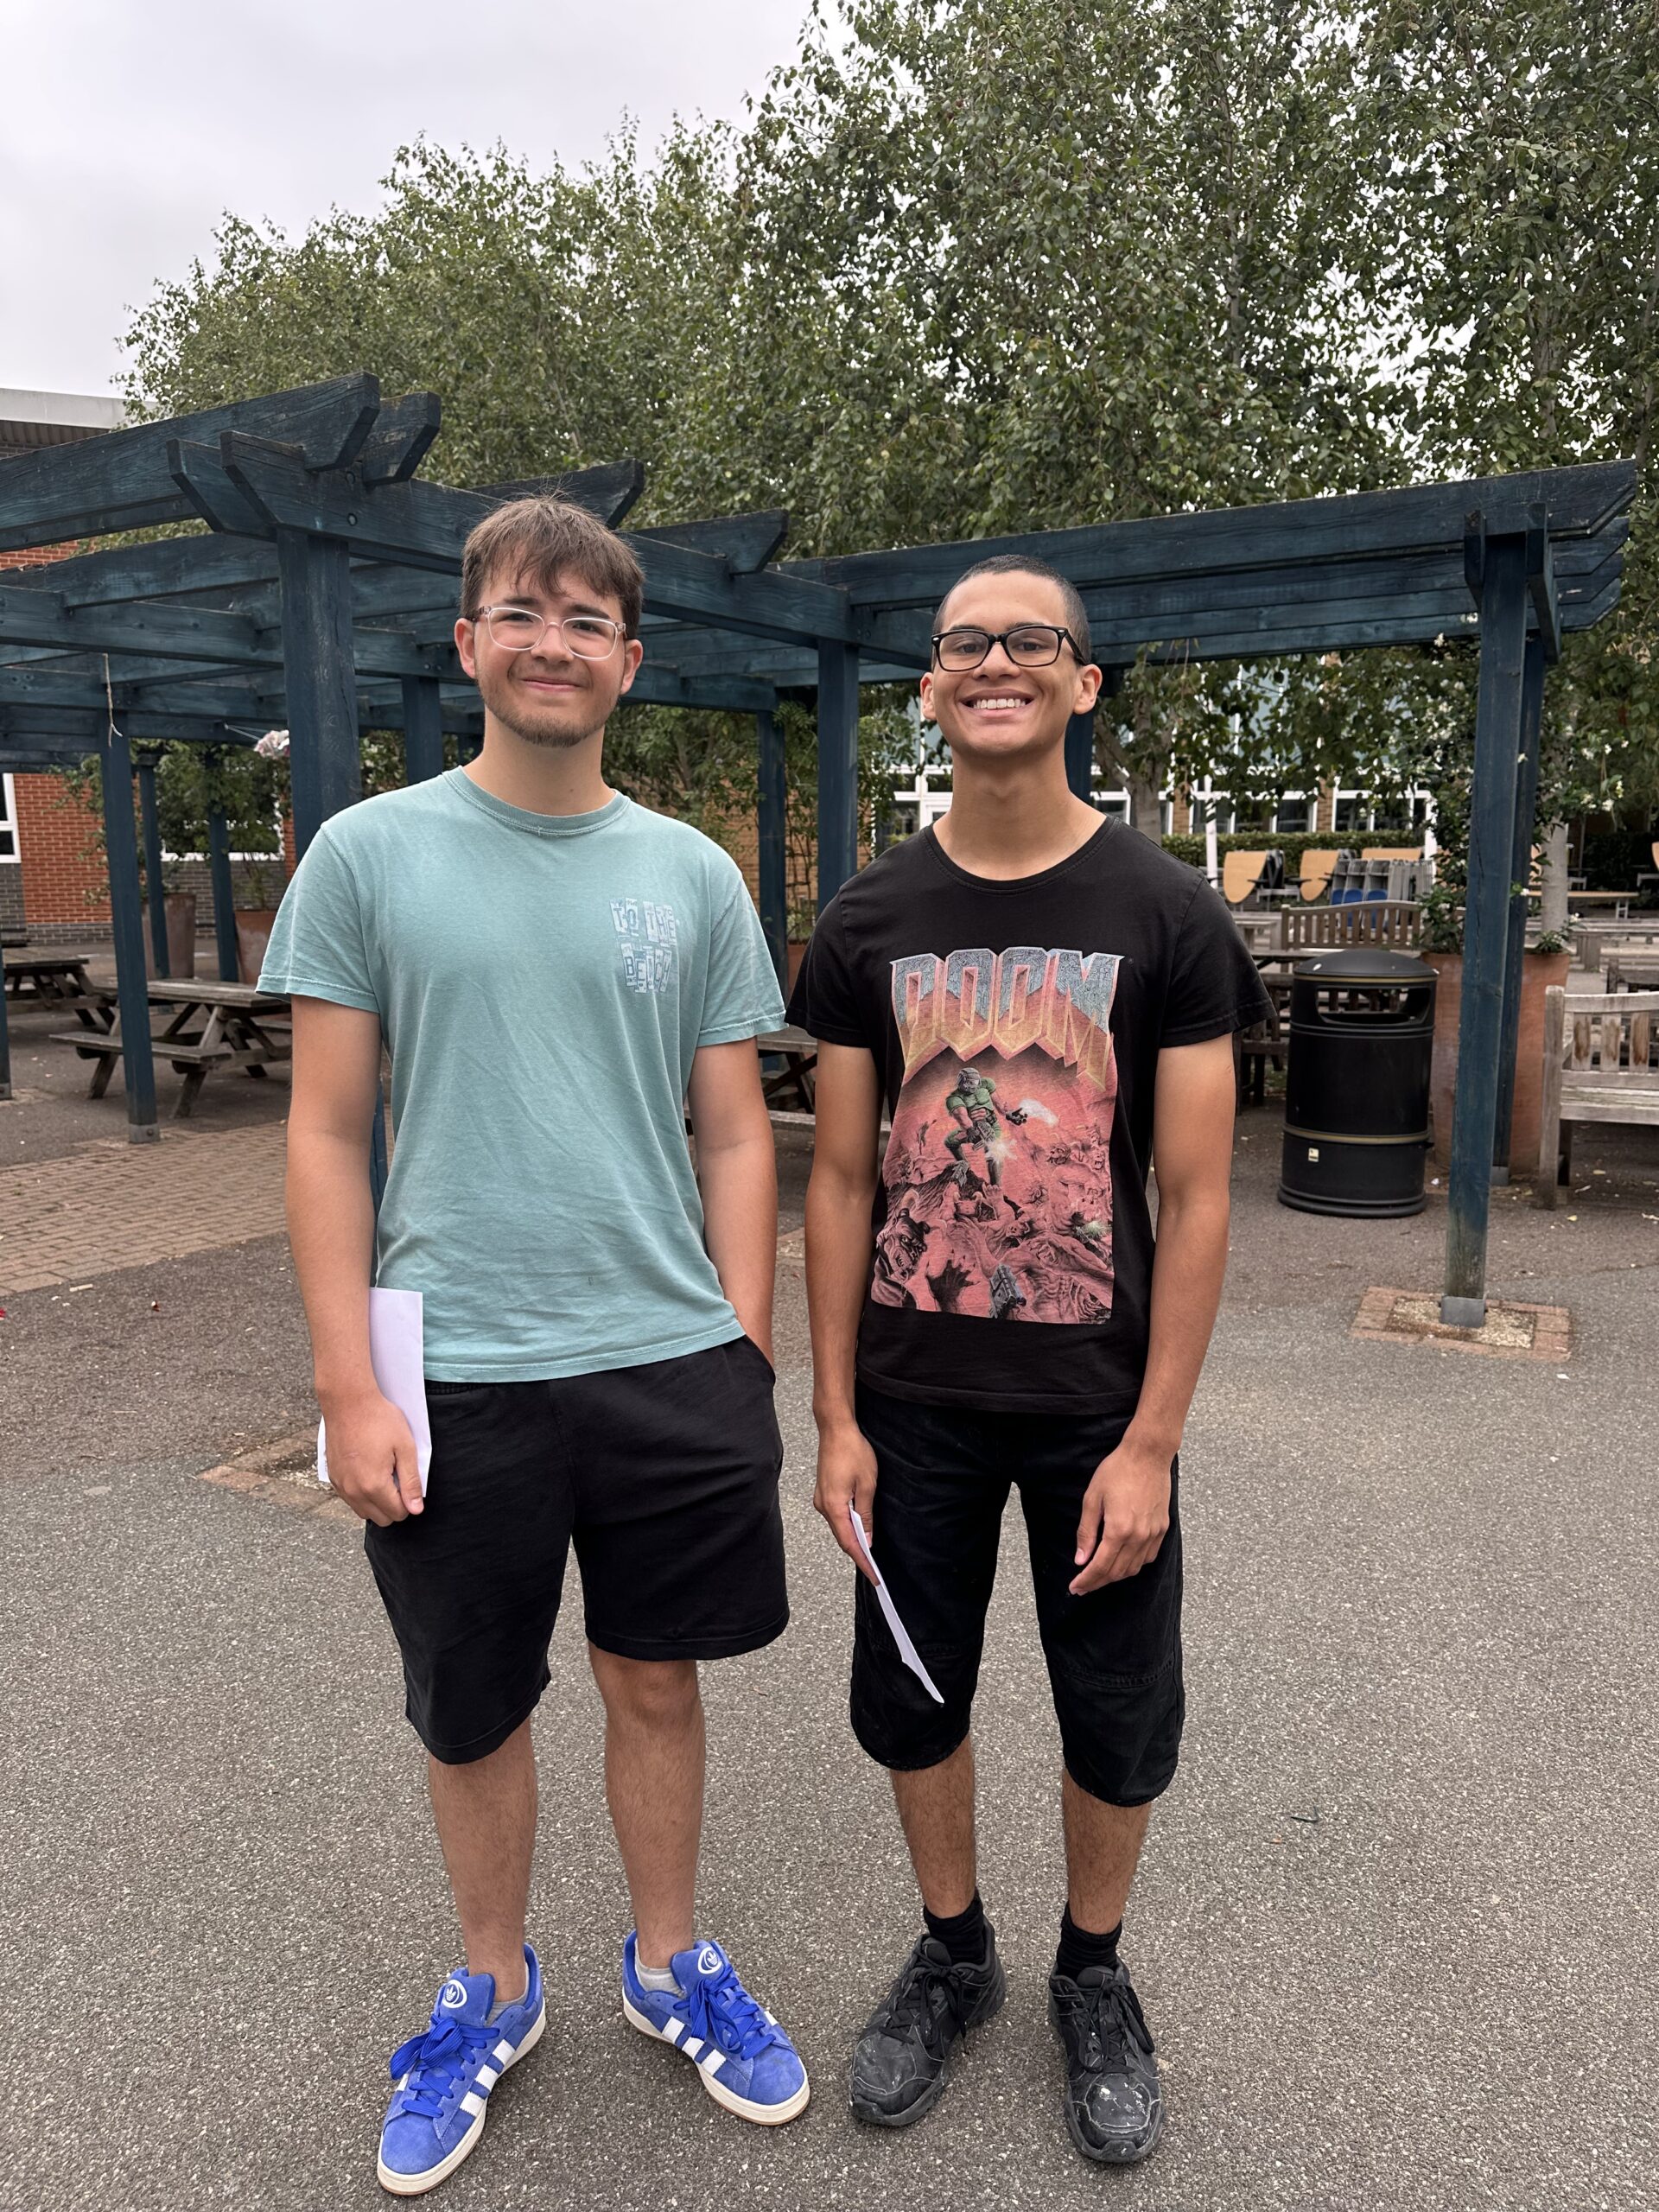
Congratulations to Waldegrave A-level students who have again obtained excellent results across all subjects. Of all grades awarded, 11% of these were A*, 42% A*/A and 78% A*-B. 20% of students achieved three A grades or above.
Commenting on the results Ms Tongue, Headteacher at Waldegrave School, said “I am so happy to see the fantastic results our students have achieved. They have worked incredibly hard throughout the sixth form and thoroughly deserve their success. In addition to congratulating our students, I would like to thank the school staff for all their hard work supporting our students’ aspirations. It has been wonderful talking to students and parents this morning and hearing their excitement about their next steps.”
It is incredibly exciting to see the wide range of courses and careers that students have chosen to pursue this year including Architecture, Computer Science & Mathematics, Drama & Theatre Studies, Fine Arts, Film Production, Law, Modern Languages & Linguistics, Molecular Bioengineering, Politics & International Relations, Primary Education, Radiotherapy & Oncology and Zoology.

How do Waldegrave GCSE and A Level compare to National results?
KS4 / GCSE Results
| 2024 | 2023 | 2022 | 2021 | 2020 | 2019 | 2018 | |
| Progress 8 Score | 0.78 | 0.93 | 0.62 | N/A | N/A | 0.83 | 0.76 |
| Attainment 8 | 64 | 65 | 65 | 67 | 66 | 64 | 60 |
| % of pupils achieving Grade 4 or above in GCSE English and Maths | 93% | 92% | 91% | 93% | 90% | 88% | 84% |
| % of pupils achieving Grade 5 or above in GCSE English and Maths | 75% | 76% | 75% | 81% | 76% | 72% | 70% |
| Grades achieved 9-7 | 46% | 48% | 54% | 58% | 53% | 50% | 44% |
| Grades achieved 9-4 | 93% | 93% | 94% | 96% | 97% | 91% | 89% |
| % of students entered EBACC | 60% | 57% | 61% | 62% | 63% | 70% | 67% |
| EBACC APS | 5.8 | 5.8 | 6.0 | 6.3 | 6.0 | 6.0 | 5.6 |
KS5 / A Level Results
| 2024 | 2023 | 2022 | 2021 | 2020 | 2019 | |
| Average Grade | B | B | B+ | A- | B+ | B- |
| Grades A* | 10% | 11% | 24% | 22% | 19% | 13% |
| Grades Achieved A* – A | 36% | 44% | 53% | 55% | 51% | 42% |
| Grades Achieved A* – B | 67% | 71% | 80% | 84% | 78% | 71% |
| Grades Achieved A* – C | 89% | 94% | 93% | 94% | 95% | 89% |
| Level 3 Value Added | 0.22 | N/A | N/A | N/A | N/A | 0.05 |